malindo's portfolios
Wind Energy and Its Potential to Mitigate Climate Change
First Part: Harnessing Wind Energy as an Option to Mitigate Climate Change (Video Presentation)
Authors: Malindo Wardana and Yerzhan Aisayev (LinkedIn)
Second Part: On the Potential of Wind Energy to Mitigate Climate Change (An Essay)
Author: Malindo Wardana
Introduction
This essay aims to show that wind energy can mitigate climate change to a certain level. The essay is structured in such order: the following section describes what causes climate change and the sector responsible for it, how wind energy can mitigate climate change, and the advantage and controversies of wind energy implementation. Next, the essay shows the potential and realistic capability of harnessing wind energy to prevent climate change with some data from the actual implementation in major emitter countries/ regions. Subsequently, the essay reveals some barriers wind energy implementations are facing and ways to overcome that. Finally, the essay shows that wind energy is and will continue to be an important player in climate change mitigation.
Background
Greenhouse gases (GHG) have been the major contributor to climate change and reducing it will mitigate the effect of climate change. Shukla, P. et. al. (2022) estimated that the gases have increased the world temperature by around 1.6 degrees Celsius from 1750 until now. To prevent irreversible damage, Paris Agreement aims to limit the temperature rise to well below 2 degrees Celsius compared to the pre-industrial era (United Nations Climate Change, 2023). Globally, electricity and heat generation emitted the most GHG in 2019 (Ritchie, H. et. al., 2020). From the total electricity generation, British Petroleum (2022) estimated that in 2021 around 62% of it was produced by fossil fuels. In comparison, around 15% was produced by hydroelectric, 13% from renewable energy other than hydro (including solar power and wind power), 9% from nuclear, and 1% from other. If the electricity from renewable energy can displace a substantial amount of the electricity produced from fossil fuels, the world would mitigate its GHG emissions thereby preventing irreversible climate change to happen.
Tapping wind energy via a wind turbine is one of the potential renewable energy technologies to replace the electricity from fossil fuels. On the one hand, wind energy has a significant amount of avoided CO2 per 1 GW of electricity from fossil fuel displaced compared to other renewable technologies. Based on IEA (2022a) data, every gigawatt (GW) of offshore wind installed capacity displaced 3.5 Mt CO2 from burning unabated coal while 1 GW of onshore wind installed capacity displaced 2.8 Mt CO2. In comparison, hydroelectric technology could displace 3 Mt CO2 while solar PV utility could displace 1.4 Mt CO2 per GW installed capacity. On the other hand, the cost of generating electricity from onshore wind energy is comparable with fossil fuel generation, (International Renewable Energy Agency (IRENA), 2022). Since the cost of generating electricity directly affect the wholesale price of electricity in the market, a lower generating cost means a cheaper wholesale price. Electricity with the cheapest price will take priority in the dispatch schedule in a competitive market due to the merit order effect, thus displacing the electricity from a more expensive technology (Australian Energy Market Commission (AEMC), 2023). Furthermore, (IRENA) (2019) estimated that onshore and offshore wind would produce 35% of the total electricity generation in 2050, thus becoming the major electricity producer. Hence, wind energy has a good potential to mitigate GHG emissions. The next section will describe in more detail the technology, advantage, controversy, potential, and realistic mitigation capabilities of wind power.
The basic principle of harnessing wind energy by a turbine
Wind kinetic energy that can be extracted by a turbine depends on the wind speed, length of the turbine's rotor, efficiency of the machine, and density of air (Burton, T. et. al., 2021). Wind speed affects a turbine's power output the most since doubling it results in eight times the power produced. The next significant parameter is rotor length because doubling it multiplies the power output fourfold. There is a physical limit to the efficiency of the machine which is 0.593 (Betz-Lancaster Limit) (Burton, T. et. al., 2021). This means a wind turbine's efficiency is always less than the limit. Most turbines can extract around 50% of the energy from the wind (United States Department of Energy, 2015).
To reach economies of scale, extraction of wind power is done by multiple wind turbines in a wind farm. One of the modern wind farms, Hornsea 2 in the UK, has 165 turbines and can produce 1.3 GW of electricity (Orsted, 2022). Before constructing a farm in a location, a developer considers average wind speed and wind distribution in the region, among many other factors. Naturally, there are some regions in the world having higher wind speeds than others (refer to Figure 1). Apart from wind speed, wind distribution can be obtained from a wind rose, which gives details on the frequency of wind blowing from each direction for a given place and period (ESRI, 2022).

Figure 1: Mean wind speed at 100 meters above the ground for different regions.
Note. From/Adapted from Global Wind Atlas. https://globalwindatlas.info/en/download/high-resolution-maps/World. Copyright 2022 Global Wind Atlas.

Figure 2: A wind rose.
Note. From/ Adapted from ESRI. Wind rose. https://www.epa.gov/sites/default/files/2019-01/documents/how_to_read_a_wind_rose.pdf. Copyright 2022 ESRI.
An advantage of tapping wind energy to mitigate CO2
The main advantage of wind energy is its cost-effectiveness in producing electricity. This metric is important because it determines the economic viability of a technology. Levelized Cost of Electricity (LCOE) is used to compare the cost-effectiveness of different technologies to produce electricity. LCOE is the ratio between costs incurred during the lifetime of a technology and its electricity generation in the same period. IRENA (2019) estimated the range of global LCOE of onshore wind in 2018 to be between 0.04-0.10 USD2018/kWh in 2018 and projected to decrease to 0.03-0.05 USD2018/kWh in 2030 and 0.02-0.03 USD2018/kWh in 2050. For offshore wind, it is between 0.10-0.20 USD2018/kWh in 2018 and is projected to decrease to 0.05-0.09 USD2018/kWh in 2030 and 0.03-0.07 USD2018/kWh in 2050. As a comparison, the LCOE for fossil-fuelled generators is currently between 0.05-0.17 USD2018/kWh. This shows that onshore wind has reached cost parity with conventional generators. In a competitive electricity market, such cost parity means wind energy can replace more electricity from fossil fuels hence reducing CO2 emissions (Australian Energy Market Commission, 2022).
The reason why wind energy has low LCOE is due to the continuous increase in capacity factor and ongoing reduction in the cost of installation. Figure 3 shows how LCOE reduces from 2010-2021 because of the change in capacity factor and installation cost. Capacity factor is the ratio between annual energy yield and the energy yield of a plant producing energy according to its rated capacity for every hour in the whole year. A higher capacity factor means a wind farm can produce closer to its nameplate capacity. It also refers to a more predictable generation. The global weighted average capacity factor of wind is around 39% in 2021 (IRENA, 2022) and is projected to increase up to 55% in 2030 for onshore wind and 58% for offshore wind (IRENA, 2019). This increase is not because the wind source becomes less volatile. Instead, the advance in technology results in a better design to extract slower wind speeds which are more prevalent (IRENA, 2019b).

Figure 3: Global weighted average total installed costs, capacity factors, and LCOE for onshore wind, 2010-2021
Note. From/ Adapted from IRENA Power Generation Cost 2021 (p.59) by IRENA. 2022. Copyright 2022 by International Renewable Energy Agency.
The controversy of wind power to mitigate CO2
One of the most important controversies of wind energy is its intermittency. Figure 4 below shows the variability of power produced from a wind farm at different times of the day. The red arrows show that on many occasions, the wind blows at a slower speed than required by a turbine, causing it to produce no power. This variability challenges the security and reliability of power systems because it affects power quality, grid scheduling plans, grid stability, and supply-demand adequacy (Diogenes et. al., 2022). The variability of wind power thus becomes a controversy because to mitigate GHG, the world needs more electricity produced by wind power. However, the more variable power supplied to a grid, the less stable it is. Diogenes et. al., (2022) revealed in their research that 94 countries face challenges to harness wind energy due to their weak grid infrastructure that would not tolerate such a degree of intermittency.
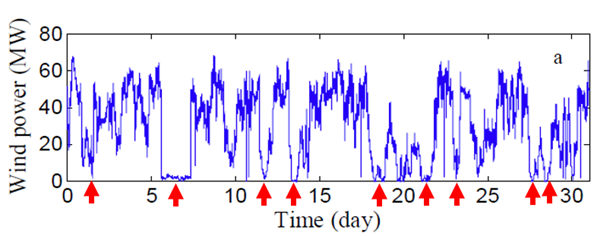
Figure 4: A typical variability of wind power in a day.
Note. From/ Adapted from Analysis of wind power intermittency based on historical wind power data by Ren, G. et al. 2018. Copyright 2018 by Elsevier Ltd.
Potential capabilities of wind energy to prevent climate change
The potential capabilities of wind energy to mitigate GHG lies in its fast growth. International Renewable Energy Agency (IRENA) (2019a) estimates that the onshore wind capacity in 2030 would be 1,787 GW or three times the capacity registered in 2018 and in 2050 would be 5,044 GW or ten times the 2018’s capacity. Offshore wind will grow from 23 MW in 2018 to 228 MW in 2030 and to around 1,000 MW in 2050. With such capacities, IRENA estimated both onshore and offshore wind power would produce around a third of the total electricity generation needs in 2050 and would mitigate 6.3 Gt of CO2 or around 27% from the reduction target to limit temperature rise to 1.5o C above the pre-industrial level. The next section will describe realistic mitigation achievements from major implementers of wind technologies.
Realistic capabilities of wind energy to prevent climate change
Realistic GHG mitigation capabilities of wind energy are best shown by comparing the amount of CO2 avoided in the countries/ region that has implemented the technology intensely and their emission level. The top three regions with the highest wind installed capacity are China, the United States (US), and the European Union (EU). In 2021, China installed around 40% (329 GW) of the global installed wind power cumulative capacity (824.9 GW) while the US had around 16%, and Europe around 28% (British Petroleum, 2022). While being the major implementer of wind technology, these regions are also the major emitter of GHG in the world. In 2021, China emitted around 33% of global CO2 emissions, the US around 13%, and the EU around 11% (IEA, 2022b). Cumulatively, the US has emitted around 25% of the total global CO2 emissions from 1751 to 2017, the EU around 22%, and China around 13% (Ritchie, H. et. al., 2020). By comparing those data, realistic mitigation achievement of wind power technology can be analysed.
Realistic GHG mitigation experience in China
China is leading the world in the capacity installed of both onshore and offshore wind but the mitigation effect from it is not sufficient. In 2021, the electricity generation from wind was almost 15 times the value in 2010 (IEA, 2022b). Although growing quickly, wind power produced only 8% of electricity in China in 2021 as compared to 63% from coal-powered plants (British Petroleum, 2022). Since wind supplied such a small proportion of electricity, it could only mitigate a small proportion of GHG. Barthelmie, R. and Sara C. (2018) reported that wind power avoided 0.4 GtCO2 annually in China in 2018. Meanwhile, the energy-related CO2 emissions were 9.6 GtCO2 in the same year. In other words, wind power avoided only around 4% of the emission annually based on 2018’s level of CO2 emission. Another research by Deng, X. et al. (2022) revealed that in 2019, offshore wind power mitigated almost none of the emissions from coal-fired in Guangxi, about 0.1 Tg/year in Guangdong, 1 Tg/year in Fujian, 0.4 Tg/year in Zhejiang, 2.9 Tg/year in Jiangsu, almost none in Shandong, and 0.4 Tg/year in Liaoning (refer to the figure below). As can be seen, the mitigation achieved (light blue bar for the year 2019) is very small compared to the amount of emission (the brown bars) in each region.
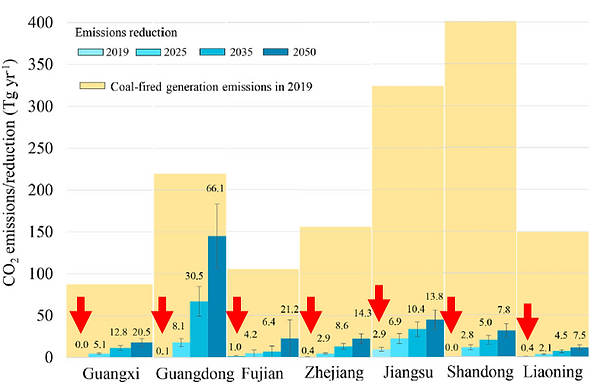
Figure 5: Mitigation evidence from several provinces in China.
Note. From/ Adapted from Offshore wind power in China: A potential solution to electricity transformation and carbon neutrality by Xi Deng et. al. 2022. Copyright 2022 by the authors.
Realistic GHG mitigation experience in the EU
Wind power mitigation potential is promising in the EU. In 11 years (2010-2021), the electricity generation from wind tripled (IEA, 2022b). There is now 255 GW of installed wind capacity, and it supplies around 17% of the total electricity in the EU-27 and the UK (Wind Europe, 2022). With such growth, Barthelmie, R. and Sara C. (2018) reported that wind power avoided 0.36 GtCO2 annually in the EU and UK while the energy-related CO2 emissions were 3.1 GtCO2. Hence, wind power avoided around 10% of the EU and UK's CO2 emissions annually based on the 2018' emissions.
Realistic GHG mitigation experience in the US
Wind power in the US is supporting CO2 mitigation efforts albeit not significant. In 2021, the electricity generation from wind power in the US was only 4 times the value in 2010 (IEA, 2022b). Still in 2021, wind cumulative installed capacity was 136 GW, and it produced around 9% of electricity in the US. As a comparison, gas produced 38% and coal produced about 26% in the same year (British Petroleum, 2022). Due to the limited share of electricity generated from wind power, it only avoided 0.18 GtCO2 annually from 4.9 GtCO2 energy-related CO2 emissions in 2018 (Barthelmie, R. and Sara C., 2018). Thus, wind power avoided around 3.5% of 2018's CO2 emissions annually.
Barriers to Wind Energy Implementation
The major implementer of wind power such as China, the US, the EU, and other countries/ regions with recent wind energy diffusion face barriers that inhibit wind power expansion to attain their climate goals. This section will discuss some of the barriers those countries experience. Diogenes et. al. (2020) classifies the barriers into technical, social, economic, and financial.
The first barrier is technical which can be in the form of system constraints, lack of skilled personnel, and lack of operations and maintenance facilities (Diogenes et. al., 2020). System constraints refer to the limited capability of current transmission infrastructure to take up more electricity supply from wind energy. The intermittent nature of wind power can cause electricity grid instability, difficulty to match supply and demand, and low power quality. China lacks long-distance transmission lines which causes a problem in connecting a wind power supply to the grid (Zhao, Z. Y. et. al. 2016). Regions in northwest China are the current most optimal option for a wind farm while 75% of electricity needs are in central and eastern China (Wang, Y., et. al., 2022). This necessitates long transmission lines with high losses and substantial costs. To overcome this, the Chinese government proposed new UHV lines be built by 2025 to raise transmission capacity from east to west from 200 GW to 300 GW (IEA, 2023). Meanwhile, in the US, Keyser, D. J., & Tegen, S. (2019) reported that the wind sector faces difficulty in hiring across most occupations in the industry. Furthermore, the authors revealed that lacking suitable candidates with skills and experience forced twenty-five percent of firms in the industry to search outside the US to fill the gap. To overcome this, the authors revealed that the US Department of Energy (DOE)’s Wind Energy Technologies Office has regularly facilitated a Wind Energy Workforce and Education Summit.
The second barrier is social which can be in the form of a lack of social/ community-level acceptance. Diogenes et. al. (2020) reported that opposition from communities is mainly based on concerns about visual impacts, noise, light, shadow flicker, and the habitat of wildlife. Aitken, M. (2010) verified that lack of community involvement in wind projects causes local opposition to wind farm construction. Meanwhile, Cohen, J. et. al. (2016) argued that clear information about a project’s benefits can change the level of opposition from residents. Therefore, governments and related stakeholders must involve communities affected as early as possible and communicate clearly about the short and long-term positive impacts of wind farms. Cohen, J. et. al. (2016) analyzed data gathered from surveys related to the delay of overhead transmission lines installations across Europe due to local communities’ opposition. Based on the data, they suggested emphasizing the long-term carbon reduction potential or economic benefit of a particular project will decrease the likelihood of opposition to the project by 10-11% on average.
The third is economic and financial barriers. Some examples of it are lacking access to capital, high cost of capital, and lacking or limited financial institutions or instruments (Diogenes et. al., 2020). Lacking access to capital is a serious problem because construction finance takes up the biggest portion of wind power installation (Global Wind Energy Council, 2022). Meanwhile, a high cost of capital can be due to uncertainty of the wind industry's revenue and the perception that the market is not yet matured. From 2009 to 2021, Feed-in-Tariff (FiT) in China provided a means to gauge the stability of revenue by specifying a fixed amount of payment for every kWh sent to grids, thus supporting the deployment of onshore and offshore wind (IEA, 2021). However, China terminated Feed-in-Tariff (FiT) in 2021 which led to a 39% drop in installations to 30.7 GW in the same year (Global Wind Energy Council, 2022). Still in China, limited financial institutions manifest in the fact that many insurance companies prefer to stay out of the wind power sector because of its risk and immaturity of the market (Zhao, Z. et. al., 2016). The government's active role is needed to ease these barriers.
Concluding Remarks
Wind power can mitigate GHG emissions and would be a preferred way to achieve significant CO2 mitigation in the future due to its cost competitiveness and quick growth. Its cost competitiveness allows a rapid uptake in many countries, making it supply more electricity to displace those from burning fossil fuels. However, the mitigation potential can be reduced by obstacles such as technical, social/ community level acceptance, and economic and financial barriers. Wind power's ability to mitigate will become greater if there are more initiatives from the governments of countries around the world to address those barriers.
References
Australian Energy Market Commission (AEMC). 2023.
How power is dispatched across the system. https://www.aemc.gov.au/energy-system/electricity/electricity-market/how-power-dispatched-across-system)
Aitken, M. (2010). Why we still don’t understand the social aspects of wind power: A critique of key assumptions within the literature. Energy policy, 38(4), 1834-1841.
British Petroleum. 2022. Statistical Review of World Energy. https://www.bp.com/content/dam/bp/business-sites/en/global/corporate/pdfs/energy-economics/statistical-review/bp-stats-review-2022-full-report.pdf
Jenkins, N., Burton, T. L., Bossanyi, E., Sharpe, D., & Graham, M. (2021). Wind energy handbook. John Wiley & Sons.
Cohen, J., Moeltner, K., Reichl, J., & Schmidthaler, M. (2016). An empirical analysis of local opposition to new transmission lines across the EU-27. The Energy Journal, 37(3).
Deng, X., Xu, W., Xu, Y., Shao, Y., Wu, X., Yuan, W., & Qin, Z. (2022). Offshore wind power in China: A potential solution to electricity transformation and carbon neutrality. Fundamental Research.
Department of Industry, Science, Energy and Resources. (2020). Australian Energy Statistics, Table O Electricity generation by fuel type 2018-19 and 2019. https://www.energy.gov.au/publications/australian-energy-statistics-table-o-electricity-generation-fuel-type-2018-19-and-2019
Diógenes, J. R. F., Claro, J., Rodrigues, J. C., & Loureiro, M. V. (2020). Barriers to onshore wind energy implementation: A systematic review. Energy Research & Social Science, 60, 101337.
ESRI. (2022). Wind Rose. https://support.esri.com/en-us/gis-dictionary/wind-rose
Global Wind Energy Council. (2022). Global Wind Report 2022. https://gwec.net/global-wind-report-2022/
Hannah Ritchie, Max Roser and Pablo Rosado (2020) - "CO₂ and Greenhouse Gas Emissions". Published online at OurWorldInData.org. Retrieved from: 'https://ourworldindata.org/co2-and-greenhouse-gas-emissions' [Online Resource]
IEA. (2021). Feed-in tariff for onshore and offshore wind. https://www.iea.org/policies/5002-feed-in-tariff-for-onshore-and-offshore-wind
IEA. (2022a). Annual direct CO2 emissions avoided per 1 GW of installed capacity by technology and displaced fuel. https://www.iea.org/data-and-statistics/charts/annual-direct-co2-emissions-avoided-per-1-gw-of-installed-capacity-by-technology-and-displaced-fuel
IEA. (2022b). World Energy Outlook 2022. https://www.iea.org/reports/world-energy-outlook-2022
IEA. 2023. Renewables 2022: Analysis and Forecast to 2027. https://www.iea.org/reports/renewables-2022
IRENA. (2019a). Future of Wind. https://www.irena.org/publications/2019/Oct/Future-of-wind
IRENA. (2019b). Renewable Power Generations Costs in 2018. https://www.irena.org/-/media/Files/IRENA/Agency/Publication/2019/May/IRENA_Renewable-Power-Generations-Costs-in-2018.pdf
IRENA. (2022). Power Generation Costs 2021. https://www.irena.org/publications/2022/Jul/Renewable-Power-Generation-Costs-in-2021
Keyser, D. J., & Tegen, S. (2019). The wind energy workforce in the United States: Training, hiring, and future needs (No. NREL/TP-6A20-73908). National Renewable Energy Lab.(NREL), Golden, CO (United States).
Orsted. 2022. Hornsea 2, the world’s largest windfarm, enters full operation. https://orsted.com/en/media/newsroom/news/2022/08/20220831559011
Ren, G., Wan, J., Liu, J., Yu, D., Soder, L. (2018). Analysis of wind power intermittency based on historical wind power data. Energy, 150, 482-492. https://doi.org/10.1016/j.energy.2018.02.142
Shukla, P. R., Skea, J., Slade, R., Al Khourdajie, A., Van Diemen, R., McCollum, D., ... & Malley, J. (2022). IPCC, 2022: Climate Change 2022: Mitigation of Climate Change. Contribution of Working Group III to the Sixth Assessment Report of the Intergovernmental Panel on Climate Change. Cambridge University Press, Cambridge, UK and New York, NY, USA. doi, 10, 9781009157926.
United Nations Climate Change. (2023). The Paris Agreement. https://unfccc.int/process-and-meetings/the-paris-agreement
United States Department of Energy. (2015). Wind Vision Report. https://www.energy.gov/eere/wind/wind-vision
United Nations Climate Change. 2023. Nationally Determined Contributions Registry. https://unfccc.int/NDCREG
Wang, Y., Qin, Y., Wang, K., Liu, J., Fu, S., Zou, J., & Ding, L. (2022). Where is the most feasible, economical, and green wind energy? Evidence from high-resolution potential mapping in China. Journal of Cleaner Production, 376, 134287.
Wind Europe. (2022). Wind energy in Europe. https://windeurope.org/intelligence-platform/product/wind-energy-in-europe-2022-statistics-and-the-outlook-for-2023-2027/#:~:text=In%202022%20new%20wind%20installations,compared%20with%20the%20previous%20year.
Zhao, Z. Y., Chang, R. D., & Chen, Y. L. (2016). What hinder the further development of wind power in China? —A socio-technical barrier study. Energy Policy, 88, 465-476.